
In this example, you learn about the four different key types of visual stimuli, namely:
-
bitmap: These are images (like photos or cartoons or little icons). You can create them with a drawing program like Inkscape.
-
rectangle: A square shape stimulus with a certain width and height, and a color.
-
circle: A round stimulus with a certain diameter, and a color.
-
text: Some text in a certain font type and with a color
-
line: A straight line between two colors, with width and color
| Sounds and video stimuli are not discussed here. |
Why are there different stimulus types?
These are five different types of stimuli that we need most often. Bitmaps are nice, because they can be pretty much anything you want to them to be. In fact, you can draw a rectangle with a drawing programme and save it as a bitmap file and then use it. Of course, it is then simpler just to show a rectangle.
| Below is more information on how to create bitmap stimuli. |
Where are stimuli drawn on the screen?
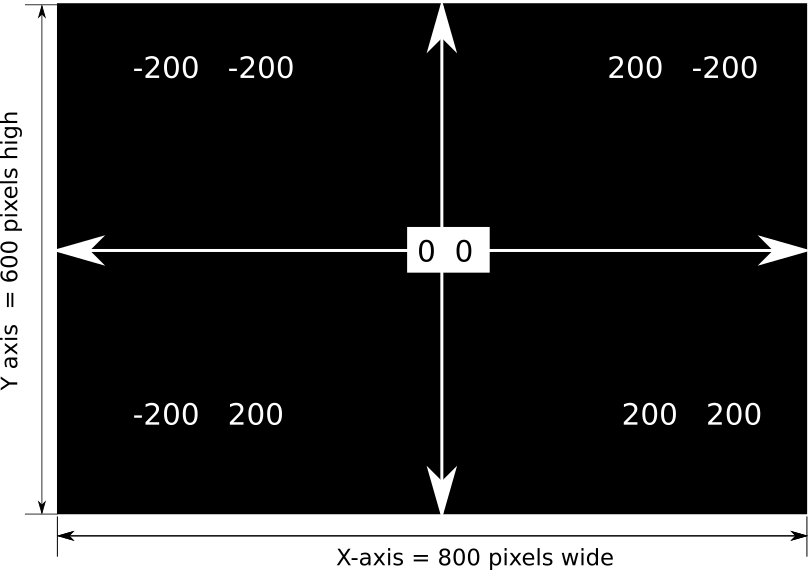
Stimuli are drawn using a so called X/Y coordinate system.
This is actually really simple. For each stimulus, you need to specify where it is shown on the "horizontal X axis" and on the "vertical Y axis".
| We measure things in pixels, which is the unit of measurement. One pixel is a really small dot of light. Your screen is most likely in total 1920 pixels wide and 1080 pixels high, but your browser window only uses part of that. You can change the screen area to any you want (read more), but 800 by 600 is the default. |
The total screen size for drawing stimuli is by default 800 by 600 pixels.
task coordinates
  keys space
  show text "-200 / -200" -200 -200
  show text "200 / -200"   200 -200
  show text "0 / 0"          0    0
  show text "-200 / 200"  -200  200
  show text "200 / 200"    200  200
  readkey 1 10000

block test
  tasklist
    coordinates 1
  end
How to draw these stimuli on the screen
In the table below, you see how to tell PsyToolkit to draw a bitmap, rectangle, circle, or text.
| Type | Syntax | Example |
|---|---|---|
bitmap |
show bitmap name x y |
show bitmap my_mouse 100 200 |
rectangle |
show rectangle x y width height R G B |
show rectangle -200 -200 75 30 255 0 0 |
show rectangle x y width height |
show rectangle -200 -200 75 30 |
|
circle |
show circle x y radius R G B |
show circle -200 -200 75 30 255 0 0 |
text |
show text "text" x y R G B |
show text "Hello participant." 200 -200 0 255 0 |
line |
show line x1 y1 x2 y2 R G B |
show line 0 0 200 200 255 255 255 |
| Instead of R G B color coordinates, you can also just use a color name (red,green,blue,white,yellow,pink,purple,black,orange,brown,lightblue). |
In the table above, x and y tell the computer where to show the stimulus. This is measured in pixels. PsyToolkit assumes the screen is 800 pixels wide and 600 pixels high. Modern screens are much bigger and you can change the used screen size with the "resolution" option (read more).
Colors can be specified in so-called Red-Green-Blue (RGB) values. Each value ranges from 0 to 255. Thus, RGB 255,0,0 has full red, but no green and blue. Learn more about RGB colors here. It is very simple and a standard way of specifying colors on computer screens.
| Click the color button above this line and select an RGB color to see how the RGB color system works. |
| The instruction rectangle can have 7 parameters. At first, that might look confusing, but in the end, it gives you a lot of flexibility. Just remember the order. You can leave out the last 3 RGB numbers, for example just show rectangle 100 100 10 10 will just show a white (default) rectangle. |
Example code
The example code below shows two bitmaps, a rectangle, a circle, and a text. You can run it so you see what it does.
bitmaps
  fixpoint
  my_mouse

fonts
  arial 20

task my_task
  show bitmap my_mouse
  delay 500
  show bitmap my_mouse 100 200
  delay 500
  show rectangle -200 -200 75 30    255 0 0
  delay 500
  show circle -200 200 25    255 255 0
  delay 500
  show text "Hello participant." 200 -200    0 255 0
  delay 1000

block test
  tasklist
    my_task 1
  end
Running the example code above
First run the experiment to see what it does.
| This example code does not create any "data", which is why nothing happens if you click the "show data" button after the demonstration. |
When and how to use which type of stimulus
The bitmap is the most useful type of stimulus, but sometimes all you need is something as a little square or cirlce. Below I explain how and when to use them.
Bitmaps
A PsyToolkit bitmap is an image. It can be large (like a photo of a landscape) or small (like a fixation point).
You create bitmaps with other software. Here are ways to get them:
-
Make your own bitmap with Inkscape (lesson about this here).
-
Find bitmaps on Google or other search engine (example link for search cat images).
-
Take your own picture with your camera.
| Digital photos are often much larger than the screen would allow; you should resize them to an appropriate size. This is a great website to do this in your browser: http://imageresize.org/ |
Bitmaps can be used for many different things, such as:
-
Instructions at the beginning of an experiment
-
The "thank you" message at the end of an experiment
-
For all those stimuli that are more complex than a rectangle or a circle
Rectangles
A rectangle is simply a rectangle. In PsyToolkit they are "filled" rectangles of one color. If you want "hollow" rectangles, you should draw them in Inkscape and save as a bitmap.
Circles
A circle is simply a filled circle of one color. Pretty much same logic as for rectangles.
Texts
A text uses a font. The online version of PsyToolkit can only use three types of font: Arial, Courier, and Times. These are the most common ones.
In order to use a font, you need to "define" it first in the "fonts" section. For example, if you want to use a 18 point Arial font, you would write the following in your experiment code:
fonts
  arial 18
Or if you like the mono font in 20 points, then you can use this:
fonts
  courier 20
That way, next time when you use a "show text" instruction, it would be in that font. The first defined font is the default font. You can use more than one font and more than one different size. This is not shown in this example (but you can find out how it is done in the online documentation, it is relatively simple).
Lines
A line is simply a straight line between two points. You need to specify both points. You can provide the color as R G B or as colorname.
show line 0 0 200 200   255 255 255
show line 0 0 200 200   white