
 This lesson is an introduction to
the easy bits of the R software. This lesson helps you to get started
with R. It helps you to understand the R code used in this
lesson. There are many other simple tutorials for psychology students
on the web.
This lesson is an introduction to
the easy bits of the R software. This lesson helps you to get started
with R. It helps you to understand the R code used in this
lesson. There are many other simple tutorials for psychology students
on the web.
Introduction
R is a popular statistics program that you can download for free.
R is recommended for use with these lessons. Some people say that R is difficult. I do not think that is correct. You can do simple things very easily with R. Of course, if you want to do complicated things, it takes some skills, but that is true for all statistics software.
What is special about R?
R commands are entered on a command line. That means, you type the commands in on the keyboard, and when you do so, you will see what you type on the screen. Only after you press the enter key, the line will be processed by R.
You can do this in different programmes. If you are new to R, I strongly recommend the (free) RStudio, which helps you with finding help, it helps you with writing R commands the correct way, etc. RStudio is a brilliant piece of software, and probably the best R interface.
How to get R
| Linux users can, of course, install RStudio via their standard software manager. |
Running R from within Emacs
Normally, you just start R like you would start other programmes. For most people, this means clicking on the program Icon.
Command line prompt
For the rest of this lesson, it is assumed that you have installed R successfully and that you know how to start it.
When you start up R, you will see the command line prompt.
Every time you want to do something, you need to type it on the command line and then press enter. Then, the resulting output will be shown. An example of this is shown below (note that this is this time not using RStudio):
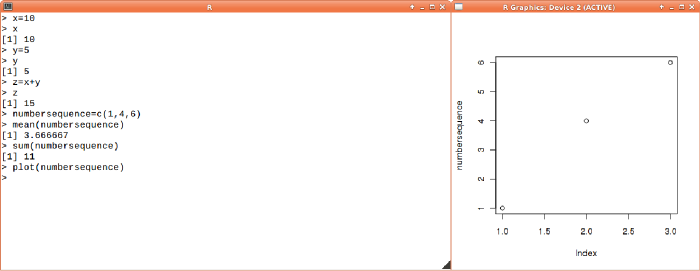
Let us just go through what you see in the above image. You see two windows. The left window is the window with the prompt. You see the commands that I typed.
-
x=10 just means that I want a variable called x, and that I want that that variable has the value 10
-
x just asks R to show me the value of x. The next line is the output. The [1] just means that x contains one level of data, and this information can just be ignored (but might be useful in special situations, which are irrelevant for now).
-
y=5 just means that I want another variable, now called y, and I want it to contain the value 5. When I type just y, I will get its value.
-
z=x+y asks R to create a variable z. I ask to add the values of x and y and put the resulting value, which is of course 15, into z. If I type just z, I get the value.
-
numbersequence=c(1,4,6) asks R to create a new variable called numbersequence. Instead of putting just one value in it, I ask to put a vector of 3 values in it. Any sequence of numbers or other information is known as a vector. The c is the concatenation function. Thus c(1,4,6) asks to create a vector of numbers, and put them in the new variable.
-
mean(numbersequence) asks for the mean of the three numbers.
-
sum(numbersequence) asks for the sum of the three numbers.
-
plot(numbersequence) asks to plot it. The plot is shown in the window on the right.
Detailed explanation of functions and arguments
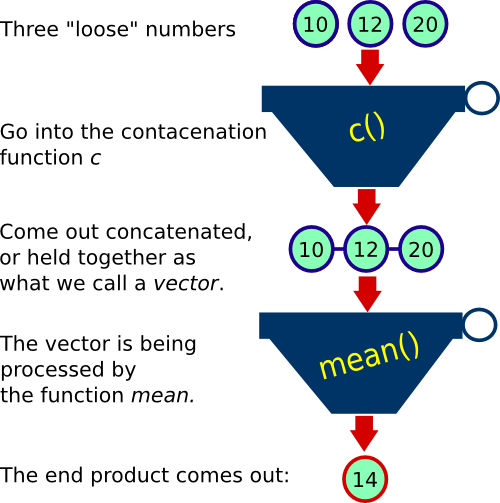
Understanding functions arguments can be difficult. When you are new to programming, it might be difficult to understand the idea of functions, arguments, and so on. In this example, the basic idea behind the line below will be explained.
mean( c( 10,12,20 ) )
The first thing to understand of this are the individual components. Below, you see that this call actually consists of two calls:
-
Step 1: concatenate the numbers 10,12,20 into one variable.
The c stands for concatenate. To concatenate means to connect into a chain. In the example, the numbers 10,12,20 are concatenated into a vector variable called myvector Concatenation is a bit like putting the numbers 10,12,20 in a little package so that they can easily be treated by other processes.
The numbers 10,12,20 are surrounded by brackets. That is just a way of notation. What this means is that they are arguments of the letter before the brackets, the c. In other words, the function c has here 3 arguments. The output of c is one new variable, something that you can best imagine as a small bag that contains three numbers. -
Step 2: carry out the function mean
The thing is, mean is a function that just wants one argument, and no more. That is why we first had to put the 10,12,20 together into one little package of numbers that we could hand over to mean. The function mean processes this and then outputs one number, namely 14.
| Note that the order of processing starts with the function c, and once that is done, the output is handed over to mean. |
Source
Instead of typing R commands in a window, you can also store the lines in a text file. For example, the commands above could all be written in a text file. Once done, you can source that file.
To do so, just do the following:
-
Step 1: Open a text editor and type the commands as above.
x=10
x
y=5
y
z=x+y
z
numbersequence=c(1,4,6)
mean(numbersequence)
sum(numbersequence)
plot(numbersequence)
-
Step 2: Start R, and type *source("easy.r")
source("easy.r")
You can type multiple commands for the command line in a file and then source that file. For example, open a text editor and type print("hello") in it, and then save it as hello.r. Next, source the file:
source("hello.r")
-
If this does not work, you have not save the file hello.r in the right folder, or in the Microsoft Windows R version, you might not have said the correct working folder (which you can set under File).
-
You will not see the output of the variables in the window where you typed source. If you want to do so, you actually need to ask to output it.
x=10
print(x)
y=5
print(y)
z=x+y
print(z)
numbersequence=c(1,4,6)
print(mean(numbersequence))
print(sum(numbersequence))
plot(numbersequence)
Variables in R
What is a variable?
Before, there were some simple examples of variables.
In R, there are different types of variables.
a = 10
x = "hello"
z = TRUE
print( x )
print( a * 2 + 5 )
print( z )
As the above example shows, variables can hold different types of information. These different types have actual names. A variable that holds a number is of the type numeric, a variable that holds one or more letters is of the type character, a variable that holds a TRUE or FALSE value is of the type boolean. Also, a whole number is generally known as an integer.
Vector variables
| This may sound complicated, but it is actually really simple! |
An import variable type is the vector. Again, you have seen this already in action above. A vector is just a series of numbers (or characters, or booleans). For example, you can have a vector of three numbers: 10,20,30.
myvector = c ( 10 , 20 , 30 )
myvector[3]
vp = c("hello","there")
print(vp[1])
| You can request a specific value of a vector by using the square brackets. Thus myvector[3] asks for the third value in myvector. |
print( myvector )
print( myvector + 4 )
plot( myvector )
The interesting thing of myvector + 4 is that you do the same addition on each value of the vector. This enables powerful calculations on many numbers in one step.
| If this is not entirely clear, please run the above examples in your R program to see what happens. Then you will immediately understand it. It is simpler than you may think. |
Boolean variables
Boolean variables are variables that can have only two values, namely TRUE and FALSE. These variables are helpful. For example, if you want to encode whether students passed an exam or not, you can use a boolean. In R, the two values are capitalized. TRUE can be abbreviated to T. FALSE can be abbreviated to F.
myvector  = c( 1, 2, 3)
myboolean = c( F, T, F)
print( myvector[ myboolean ] )
In the above example, myboolean is a vector of three booleans, F and T are shortcuts for TRUE and FALSE. The [ ] brackets select only the True values of myvector, so you should see 20.
Character variables
Character variables, also known as strings, help you to deal with text. For example, if you want to print out the mean value with a bit of text, you can do it as follows:
x=10
words="The value is"
print( paste( words , x ) )
x=10
x <- 10
Matrices, tables, and data frames
So far, you have see examples of most simple variables. Often, you need to store you information in long tables. R offers a range of solutions for this. You can even directly read in files containing tables.
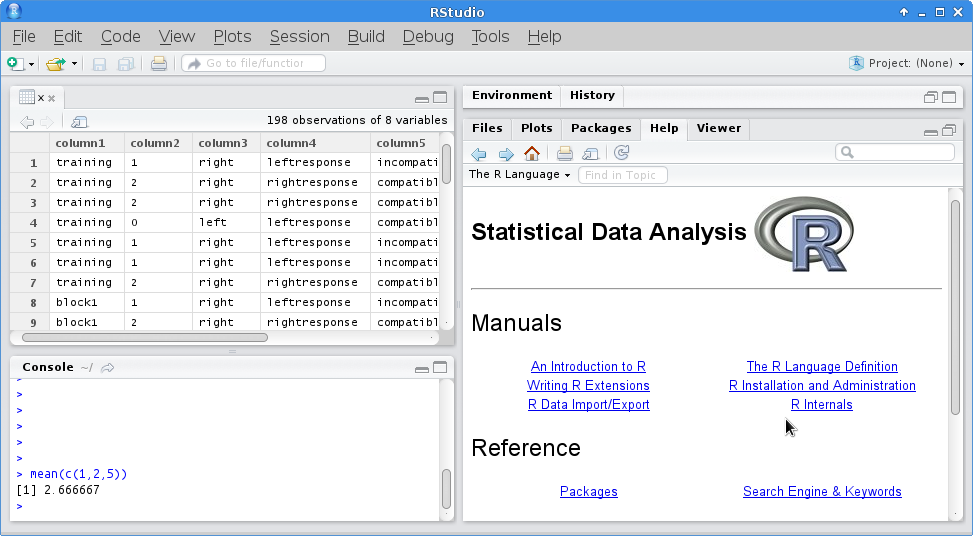
By default, the PsyToolkit data files are saved as text files. In the screenshot of RStudio you see an imported PsyToolkit datafile. Imagine you have a file called "mydata.txt", and imagine the 8th column of this file has the reaction time information, and you want to know what the average response time speed is:
d=read.table("mydata.txt")
print(mean(d[,8]))
-
R reads the datafile, which you know is in a tabular format
-
R puts the data in d. R knows it is a table with columns and rows
-
d[,8] refers to the 8th column of your table
-
apply mean to the numbers in the 8th column, and print it to the screen
Functions
In R, there are not just variables. There are also functions (see definition above). You already have seen some examples of functions, such as mean, or sum, and c. A function does something on its arguments (although a function does not necessarily have arguments). In R, you can get help on functions. For example, if you type help(mean), or simply ?mean, you get information about the function "mean". The R help system is a great way to learn about the hundreds of available functions.
| In R, functions always require to put the arguments in brackets. For example, in order to concatenate the numbers 1,2, and 3, you need to put them, comma separated, in brackets: c(1,2,3) |
R file formats
R files have the extension .r. On some operating systems, most notably Microsoft Windows, your file manager might not show the .r extension. Still, when you want to source a file, you still need to use the whole file name.
| Sourcing a file is just reading and interpreting an R file, see example below |
source("my_analysis.r")
You can also save all your variables and functions as an image file. You can do this with save.image(). You can load an image with the function load(). You can also do this from the menus in RStudio.
R and the scientific notation of p values
In R, values can be expressed in scientific notation. That happens with numbers that contain many zeros. The scientific notation is just a more efficient way of writing numbers with many zeros.
Some examples: - In scientific notion, 0.05 corresponds to 5e-2. - In scientific notion, 0.00001 corresponds to 1e-5.
The easiest way of thinking about this is how many zeros you have before the number. For example 0.0*5 has 2 zeros before the five, as in 5e-*2. And *0.0000*1 has 5 zeros before the one, and can thus be written as 1e-5, which is shorter!
| If you do not want any scientific notion, you can switch it off with options(scipen=100). If you want it back, you can set scipen to a smaller value, for example to 5. |
Plots
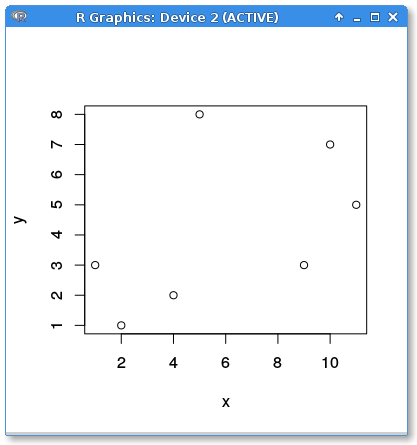
One of the really nice things of R is how nice the plots are. Simple scatter plots can be made by just using the plot function. Imagine, you have two sets of numbers, x and y, and you want to make a scatter plot. Here is how you do it. The number sequences are here defined as well.
x=c(1,4,2,5,10,11,9)
y=c(3,2,1,8,7,5,3)
plot(x,y)
x=c(1,4,2,5,10,11,9)
y=c(3,2,1,8,7,5,3)
plot(x,y,xlab="My x-axis",ylab="My y-axis",las=1,pch=19,col="red")
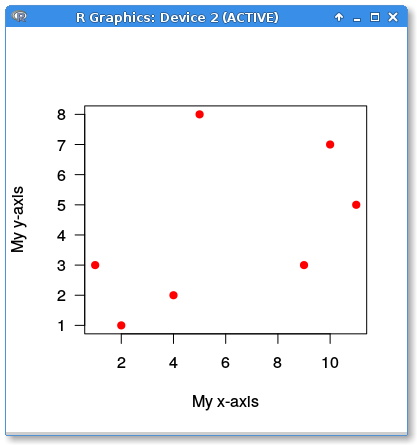
| The advantage of RStudio is that you have a lot of control over the plots you produce, and you can save them in a variety of formats. |
Comments
It is helpful to leave annotations and comments in your R code. This is a description of what the code does in your own words. This makes it helpful for others (or for yourself when you have not read the code for a long time) to understand the code.
In R files, anything following the # sign is a comment. That is helpful if you want to annotate your R files.
print(mean(1,2,3)) # this line prints the average of 1,2,3, that is 2
In summary
-
R is a programming language
-
In R, you have variables, functions, and arguments.
-
A variable is a piece of information. There are different types of variables, such as numbers, strings, and booleans. Variables can be concatenated into vectors and tables.
-
A vector is simply a series of variables, such as 1,2,3,4,5.
-
Apart from vectors, a table (or data frame) is a common way of storing information. A spreadsheet is essentially a table.
-
Functions process information. For example, the function mean calculates the mean score of its arguments.
-
R can be used to do statistical calculations and to plot statistical data.
-
You can manually type commands into R or you can source a file in which the very same commands are stored. This makes it possible to re-run the same analysis. Comments help you to describe what source files are for and start with the # sign.
And what now?
So far, you have only learned some absolute basics about R. But it helps you to understand the R files and maybe to make some minor changes to the R files.
Further reading
There are many great introductions into R on the web. Below are some links you might find helpful: